2.9 KiB
Title: Sensors Date: 2022-05-24 Category: Notes Summary: Graphs of various sensors around my house. Short: d
24h Graphs
These graphs are live and generated every 10 minutes, assuming the script works:
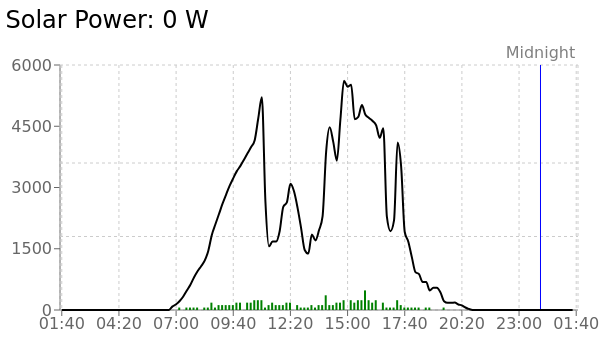
Black: power (W), green: energy (kWh)
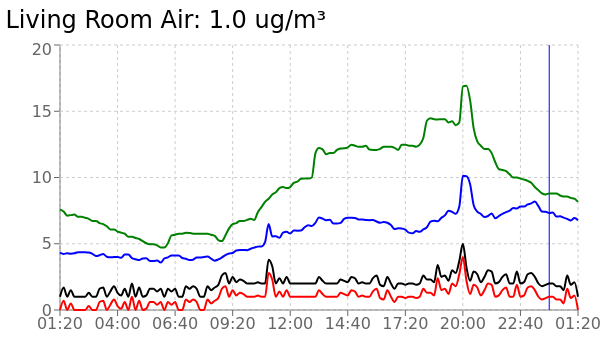
Black: PM10 (ug/m³), red: PM2.5 (ug/m³), blue: CO₂ (ppm), green: VOC
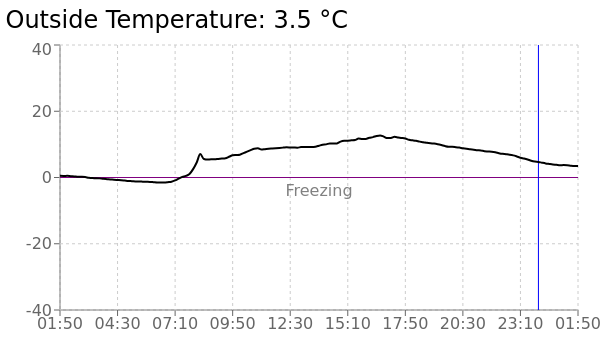
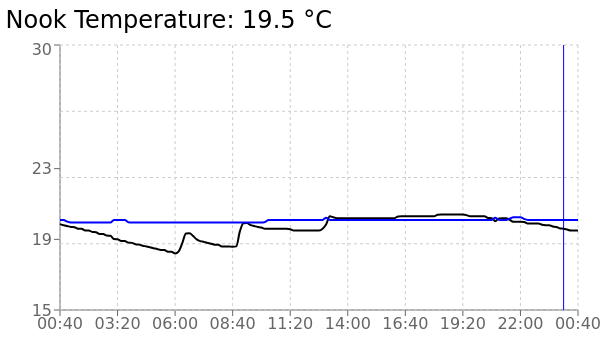
Black: temperature (°C)
Black: temperature (°C), blue: humidity (%)
Black: temperature (°C), blue: humidity (%)

Black: temperature (°C), blue: humidity (%)
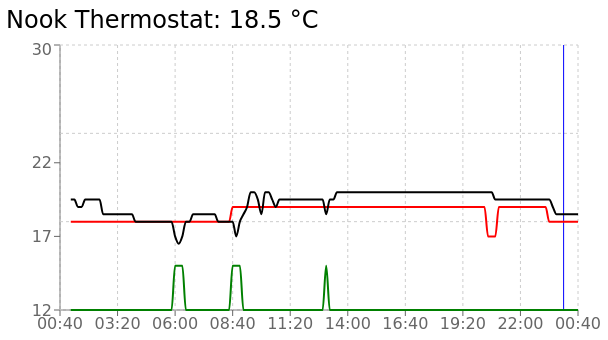
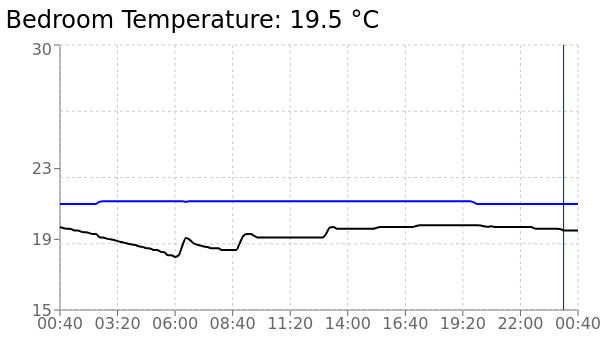
Black: temperature (°C), red: setpoint (°C), green: state (off / running)
Black: total (MJ), green: delta (MJ)
Black: total (L), green: delta (L)
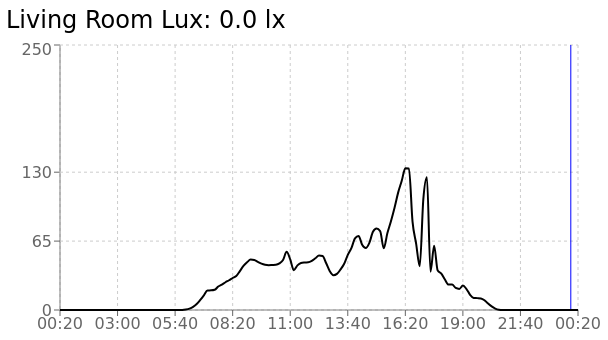
Black: light (lx)
Live Dashboard
A live interactive version can be found on this dashboard.
You can find the source code on my Gitea.
Data Capture
Most of the data is captured by two cheap RTL-SDRs (software-defined radios) that are set to listen to 433 MHz and 915 MHz radio frequencies. I use the open-source project rtl_433 to automatically decode the signals and forward them to an MQTT broker, which is a messaging server that services can publish and subscribe to. Other sensors run an MQTT client directly or expose their data through other means like a web interface that I poll.
The data gets collected by a central Python script that process and stores it in an InfluxDB database for "efficient" storage. The script also runs a web server that queries the database and exposes the data over an API to the dashboard at various dates and ranges. The dashboard is written in JavaScript / React using a simple chart library.
My biggest regret was using InfluxDB. It's a stupid database and I wouldn't recommend it to anyone. I ran into timezone issues with group by time(). It also assumes the column data type is an integer if your sensor happens to send it a whole number at first and it won't let you change that. Their docs are terrible. They dropped the SQL-like InfluxQL syntax for querying with a pipeline-like syntax called Flux in version 2.0. Debian's repos seem to be staying with version 1.x though. You can only delete data by time ranges, not values. It also logs every single thing to /var/log/syslog and there's no easy way to disable it (completely).
Just stick to Postgres / SQLite.